You will require an Intuety account with 'admin' permissions.
Login to the Intuety platform via This Link
Navigate to the 'Insights Dashboard' from the left hand menu
You will see a dashboard with the following elements:
Filters
- Contractors - Filter by specific contractors of your company.
- Status - Filter by a specific status of tasks
- Project - Filter by a specific project of your organisation.
- Date - Filter by a custom date range (default is previous week)

Metrics
- Average increase in quality score - An average figure of score improvement for RAMS
- New previously missed risks and controls added - The number of suggestions adopted.
- Average reduction in incidents per RAMS - As a percentage, a figure that correlates quality against reduction in incidents occuring.
- Key Lessons Learned Exposed to Users - Number of shared lessons, alerts and bulletins across your internal or supply chain.
- Total Risk Assessments

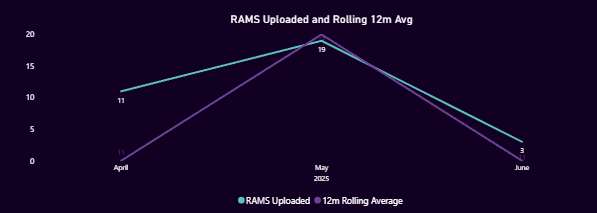
RAMS Uploaded
A graph showing the actual number of RAMS uploaded on a month by month basis and a line showing the rolling 12 month average against the actual.
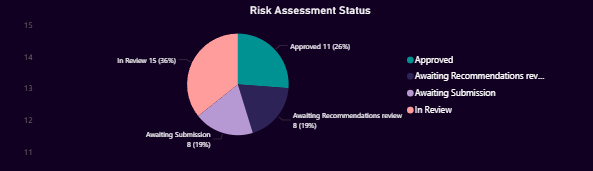
Risk Assessment Status
A pie chart highlighting the individual statuses of the RAMS for the given filters.
- Approved - Has been approved following its reviewal
- Rejected - Has been rejected following its reviewal
- Awaiting Recommendations Review - Yet to be looked at by the author, following upload.
- Awaiting Submission - Author is done, but needs to send to review.
- In Review - Currently with the reviewers, not yet approved/rejected
Average Reduction in Incidents
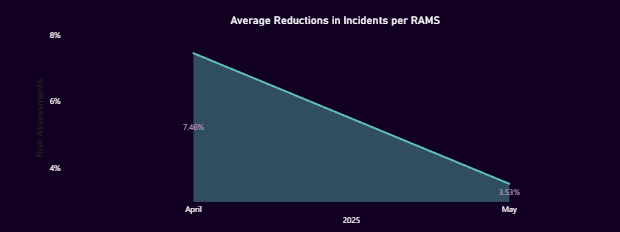
Incident reduction as a %, on a month by month basis.
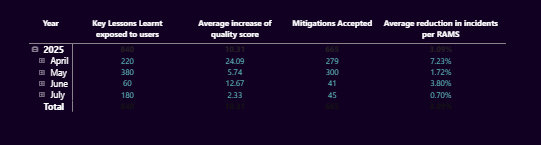
Metric Table
The same metrics of the top line, however broken down into year/month and day for a deeper insight.
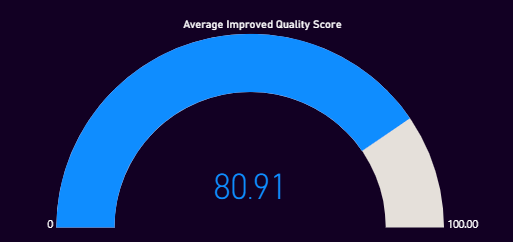
Average Improved Quality Score
The average 'Final' score for RAMS based on the applied filters. e.g typically RAMS once improved are finishing on an average score of 80.91.
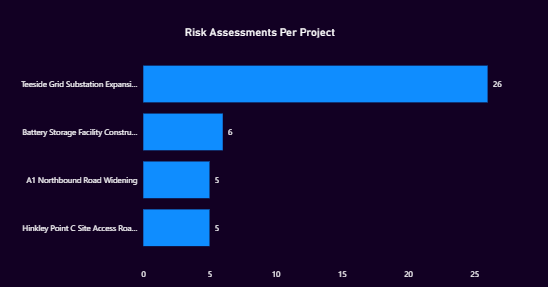
Risk Assessment by Project
A visual indicating the number of RAMS uploaded to each project, sorted by most - least.